Stuff - mainly geek, a little diabetes, some rant. Possibly all three in the same post. Basically anything I find interesting and/or worth sharing.
These are my personal views, unless I've been hacked.
Following on from yesterday's blogpost about Visual Studio external tool output, I've written a tool that will be useful to me and hopefully others. A common directory structure when using binary dependencies in your VS projects is something like this
Projects\Dependencies
Projects\KenKen\SourceCode
Projects\FizzBuzz\SourceCode
When I'm in a project that has references to libraries in the Dependencies folder, I occasionally need to check the version of the libraries I've referenced. My tool, FileVersion, takes two parameters, a start directory and a search directory, and walks up the start directory one level at a time until it finds the search directory. It then reports on the versions of the libraries (.dll and .exe) in that directory.
If the tool is called as an external tool in Visual Studio, it can be configured to search for the dependencies for the current project.
The output from running the tool looks like this in VS, saving you traversing the directory structure yourself and viewing each file's properties manually
The Problem
Imagine the scene; you've created a class library with a test project. There's an internal method you need to test (yes, you are aware of SRP, you have considered it and you have made a conscious decision to use an internal method), but because you've decorated the assembly with the InternalsVisibleTo attribute:
everything builds and runs.
Then your pairing buddy suggests you sign your class library with a strong name. You consider this suggestion and agree it's a brilliant idea, so you do it. You sign both projects with the same key:
You build the project and:
At this point you know you have to extract the public key from your executable and add it to the constructor of the attribute. You know the public key is over 300 characters and you're unlikely to be able to guess it. You remember that it's sn.exe you need to run to do extract the key, but struggle to remember the parameters or even, if you're honest, the location of the exe.
The Solution
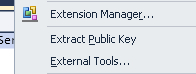
Use the External Tools facility within Visual Studio. This allows you to specify a command line to run, with optional parameters that can contain certain Visual Studio values such as the solution path, the project path or, more interestingly for us, the path to the compiled executable for the project.
Under the Tools menu, click on External Tools... This opens a dialog that allows you to specify your external tool:
From the top, the inputs are:
Title. What's displayed in the Tools menu. Note the & character before the P; this is a throwback to the early 90s when you navigated Windows 3.1 with a keyboard. It allocates a hotkey to the menu item when you press the Alt key
Command. The path and file name of the executable (sn.exe in this example).
Arguments. The command line arguments to pass to the command.
Initial Directory. The directory to run the executable in.
Use Output Window. The "wow factor" point of this post. This redirects the output to the Visual Studio output window, so the public key can be easily copied and pasted into the attribute's constructor.
When this external tool is run, assuming you have the correct project selected, now produces this in the VS output window:
A job for another day is to write a simple app to wrap sn.exe and copy the public key above, minus its spaces, into the clipboard to make life even easier. Keep an eye on GitHub for some code, possibly coming soon.
This post will show how to create a debugger visualiser for visual studio, and use it to display and update a debugged object's data. It is a step-by-step guide, and the resulting code (written in C#) can be found on GitHub. I recommend getting this code to get a feel for how to produce a visualiser.
The object that we're going to visualise has two properties: Colour and IntArray.
public class DemoObject
{
 static Random _random = new Random();

 public DemoObject()
 {
  Colour = Color.DarkOrange;
  //Build a large array that isn't easy to see in the debugger
  IntArray = InitialiseRandomArray(18, 7);
 }

 public int[,] IntArray { get; private set; }
 public Color Colour { get; set; }

 private static int[,] InitialiseRandomArray(int index1, int index2)
 {
  var intArray = new int[index1, index2];

  foreach (var i in Enumerable.Range(0, index1))
  {
   foreach (var j in Enumerable.Range(0, index2))
   {
    intArray[i, j] = _random.Next(0, 255);
   }
  }

  return intArray;
 }
}
As you can see, this is not easily viewed in the debugger:
Our object's IntArray property is a two dimensional array, which we're going to display in a table; Colour will be displayed as the background colour of a picture box.
A debugger visualiser can be a windows control or form; for this demo we'll be using a form. So, create the form, give it a name of "DemoObjectVisualiserForm". Add a textbox - make it multiline, change its name to "arrayContents" - this will be used to display the tabulated contents of the 2 dimensional array. Add a picturebox, call it "colourBox" - this will show the object's colour, rather than the description of the colour shown in the debugger.
As this form is to display an object of type DemoObject, create a constructor that takes an instance of DemoObject as its argument; store this object in a private member variable "_objectToVisualise".
To expose the visualiser API, add a reference to Microsoft.VisualStudio.DebuggerVisualizers:
Add a public class DemoObjectVisualiser, inheriting from DialogDebuggerVisualizer. Implement its Show method:
public class DemoObjectVisualiser : DialogDebuggerVisualizer
{
 protected override void Show(IDialogVisualizerService windowService, IVisualizerObjectProvider objectProvider)
 {
  //make sure the object is the correct type
  var objectToVisualise = objectProvider.GetObject() as DemoObject;

  //Show the visualiser
  var form = new DemoObjectVisualiserForm(objectToVisualise);
  windowService.ShowDialog(form);
 }
}
Show is the method that's called by the Visual Studio debugger, and takes 2 arguments: IDialogVisualizerService and IVisualizerObjectProvider. IDialogVisualizerService allows the visualiser to be displayed on the UI, and IVisualizerObjectProvider wraps the object to be visualised.
As the object is serialised to be passed between Visual Studio and the DialogDebuggerVisualizer, DemoObject must be decorated with the Serializable attribute unless you plan to implement manual serialisation and use a VisualizerObjectSource.
    [Serializable]
    public class DemoObject
In order to test your visualiser, you can use an instance of the VisualizerDevelopmentHost - this is a proxy of the Visual Studio debugger and is a quick and easy way to fire up your debugger visualiser without running your client code.
This example is a console application, with a reference to Microsoft.VisualStudio.DebuggerVisualizers
using Microsoft.VisualStudio.DebuggerVisualizers;
using VisualiserDemo;

namespace DevelopmentHostDemo
{
    class Program
    {
        static void Main(string[] args)
        {
            var objectToVisualise = new DemoObject();
            var host = new VisualizerDevelopmentHost(objectToVisualise, typeof(DemoObjectVisualiser));
            host.ShowVisualizer();
        }
    }
}
So that the debugger knows to give the option of visualising an object using our new visualiser, the object to visualise needs to be decorated with the DebuggerVisualiser attribute:
    [DebuggerVisualizer(typeof(DemoObjectVisualiser), Description="Jonesy's amazing visualiser")]
    [Serializable]
    public class DemoObject
The DemoObject is now able to be visualised in the DemoObjectVisualiserForm; run the client code and break when the DemoObject instance has been created. When you view the instance in the debugger, you'll see a small magnifying glass icon:
Click this, and your object is displayed in the form:
As well as being visualised, the object can be updated via the form. To demonstrate this, add a button to the form and in its Click event handler, hide the form.
Set the Modifiers property of the picture box to Public; this is a rough hack to enable it to be visible outside of the form. Add a Click event handler to the picture box, and add the following code to update the colour:
private void colourBox_Click(object sender, EventArgs e)
{
 //When the colour is clicked, show the dialog to change it
 var colordialog = new ColorDialog();
 var result = colordialog.ShowDialog();
 if (result == System.Windows.Forms.DialogResult.OK)
 {
  colourBox.BackColor = colordialog.Color;
 }
}
The last step to get the colour change reflected in the debugger is to update the object. Add the last few lines here to the Show method in the DemoObjectVisualiser object:
public class DemoObjectVisualiser : DialogDebuggerVisualizer
{
 protected override void Show(IDialogVisualizerService windowService, IVisualizerObjectProvider objectProvider)
 {
  //make sure the object is the correct type
  var objectToVisualise = objectProvider.GetObject() as DemoObject;

  //Show the visualiser
  var form = new DemoObjectVisualiserForm(objectToVisualise);
  windowService.ShowDialog(form);

  //If the object is replaceable, update the colour
  if (objectProvider.IsObjectReplaceable)
  {
   objectToVisualise.Colour = form.colourBox.BackColor;
   objectProvider.ReplaceObject(objectToVisualise);
  }
 }
}
This will update the debugged object with the new colour, when the save button is clicked:
Intalling Simple.Demo using NuGet
Open Package Manager Console and execute the following commands:
install-package Simple.Data.Ado
install-package Simple.Data.MySql
install-Package Mysql.Data
These install, from the top, the Simple.Data core libraries, the Simple.Data MySql library and the MySql ADO provider.
The MySql dll needs to be in the same folder as the Simple.Data.Mysql library, so ensure the project reference to this dll has its Copy Local setting to True. This will ensure it gets deployed to the bin folder when the project is built.
Using Simple.Data
Now the fun part... Simple.Data is built on the dynamic model in .Net 4; database is a dynamic object and at runtime interprets methods and properties into SQL statements, deriving the names of tables, columns etc from the context of the properties. I'm not sure that makes sense, so here are a couple of examples:
These two lines create a database connection, and insert a row into the city table. The table name city is derived from the property with the same name. ("sd" is a namespace alias, to prevent ambiguity with WebMatrix.Data.Database, ignore it if you can)
This line is an example of how to get Simple.Data to construct a query along the lines of
but with the goodness of parameterisation to defend against Sql injection attacks.
If you want to filter by more than one column, just make it up..!
For ordering data, use the OrderBy and ThenBy notation:
A downside with the dynamic model is there's no intellisense, so you can't see the database objects you want to query at development time. However, there's a tool that'll help with that, Simple.Data.Pad. Once you've copied the correct database provider dlls to the runtime directory (I needed Simple.Data.Mysql.Mysql40.dll and mysql.data.dll), you can connect to your database and as you type it'll suggest what you can do with your objects (in a nice way)
In summary, Simple.Data is easy to use and a lot of fun - far more so than hand-crafting Sql statements, especially if you want the additional goodness of being able to swap around your database providers without ruining your client code. I've only scratched the surface here, but you can learn more at http://blog.markrendle.net/
Download Simple.Data at GitHub
Read more instructions here GitHub wiki
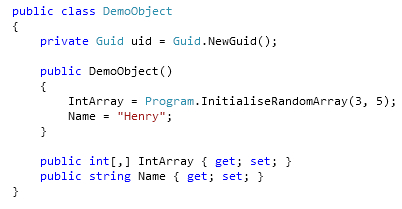
When an object is viewed in the debugger, by default each value displayed is the result of the class, struct, property or fields's ToString() method. As an example, this object:
would be displayed like this in the Watch / Locals windows:
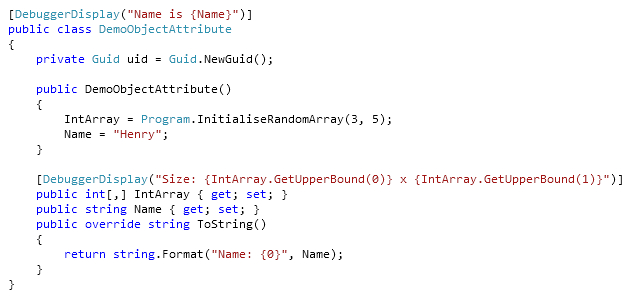
If you want to display more useful information, you can decorate the class, struct, property or field with the DebuggerDisplay attribute. The attribute's constructor takes a string parameter, which specifies the caption to display. The string can contain expressions to evaluate, if enclosed in curly braces; expressions can include properties of the object being displayed. This example shows the class display as a string containing the contents of the name property, and the IntArray display showing the size of the array.
The object with the attributes is displayed like this:
This attribute can be applied to fields or properties of an object, to determine how they are displayed in the Visual Studio debugger windows.The constructor has a single parameter, of type DebuggerBrowsableState. this is an enum with three values: Never, Collapsed and RootHidden. The "default" for objects without this attribute is to be shown as Collapsed.
As an example, an object I've contrived that looks like this:
would be displayed in the debugger like this:
We can hide properties and fields from the debugger by decorating them with the attribute, initialised with "Never" - note the usage on a private field, which enforces the concept of encapsulation; a principle that from now on I'll be calling ASYPIP (Avoid showing your privates in public)
This object is displayed like this:
The last value of DebuggerBrowsableState is RootHidden - this does not show the property or field itself, but shows its child elements as direct descendants of the object. So, an object decorated like this...